
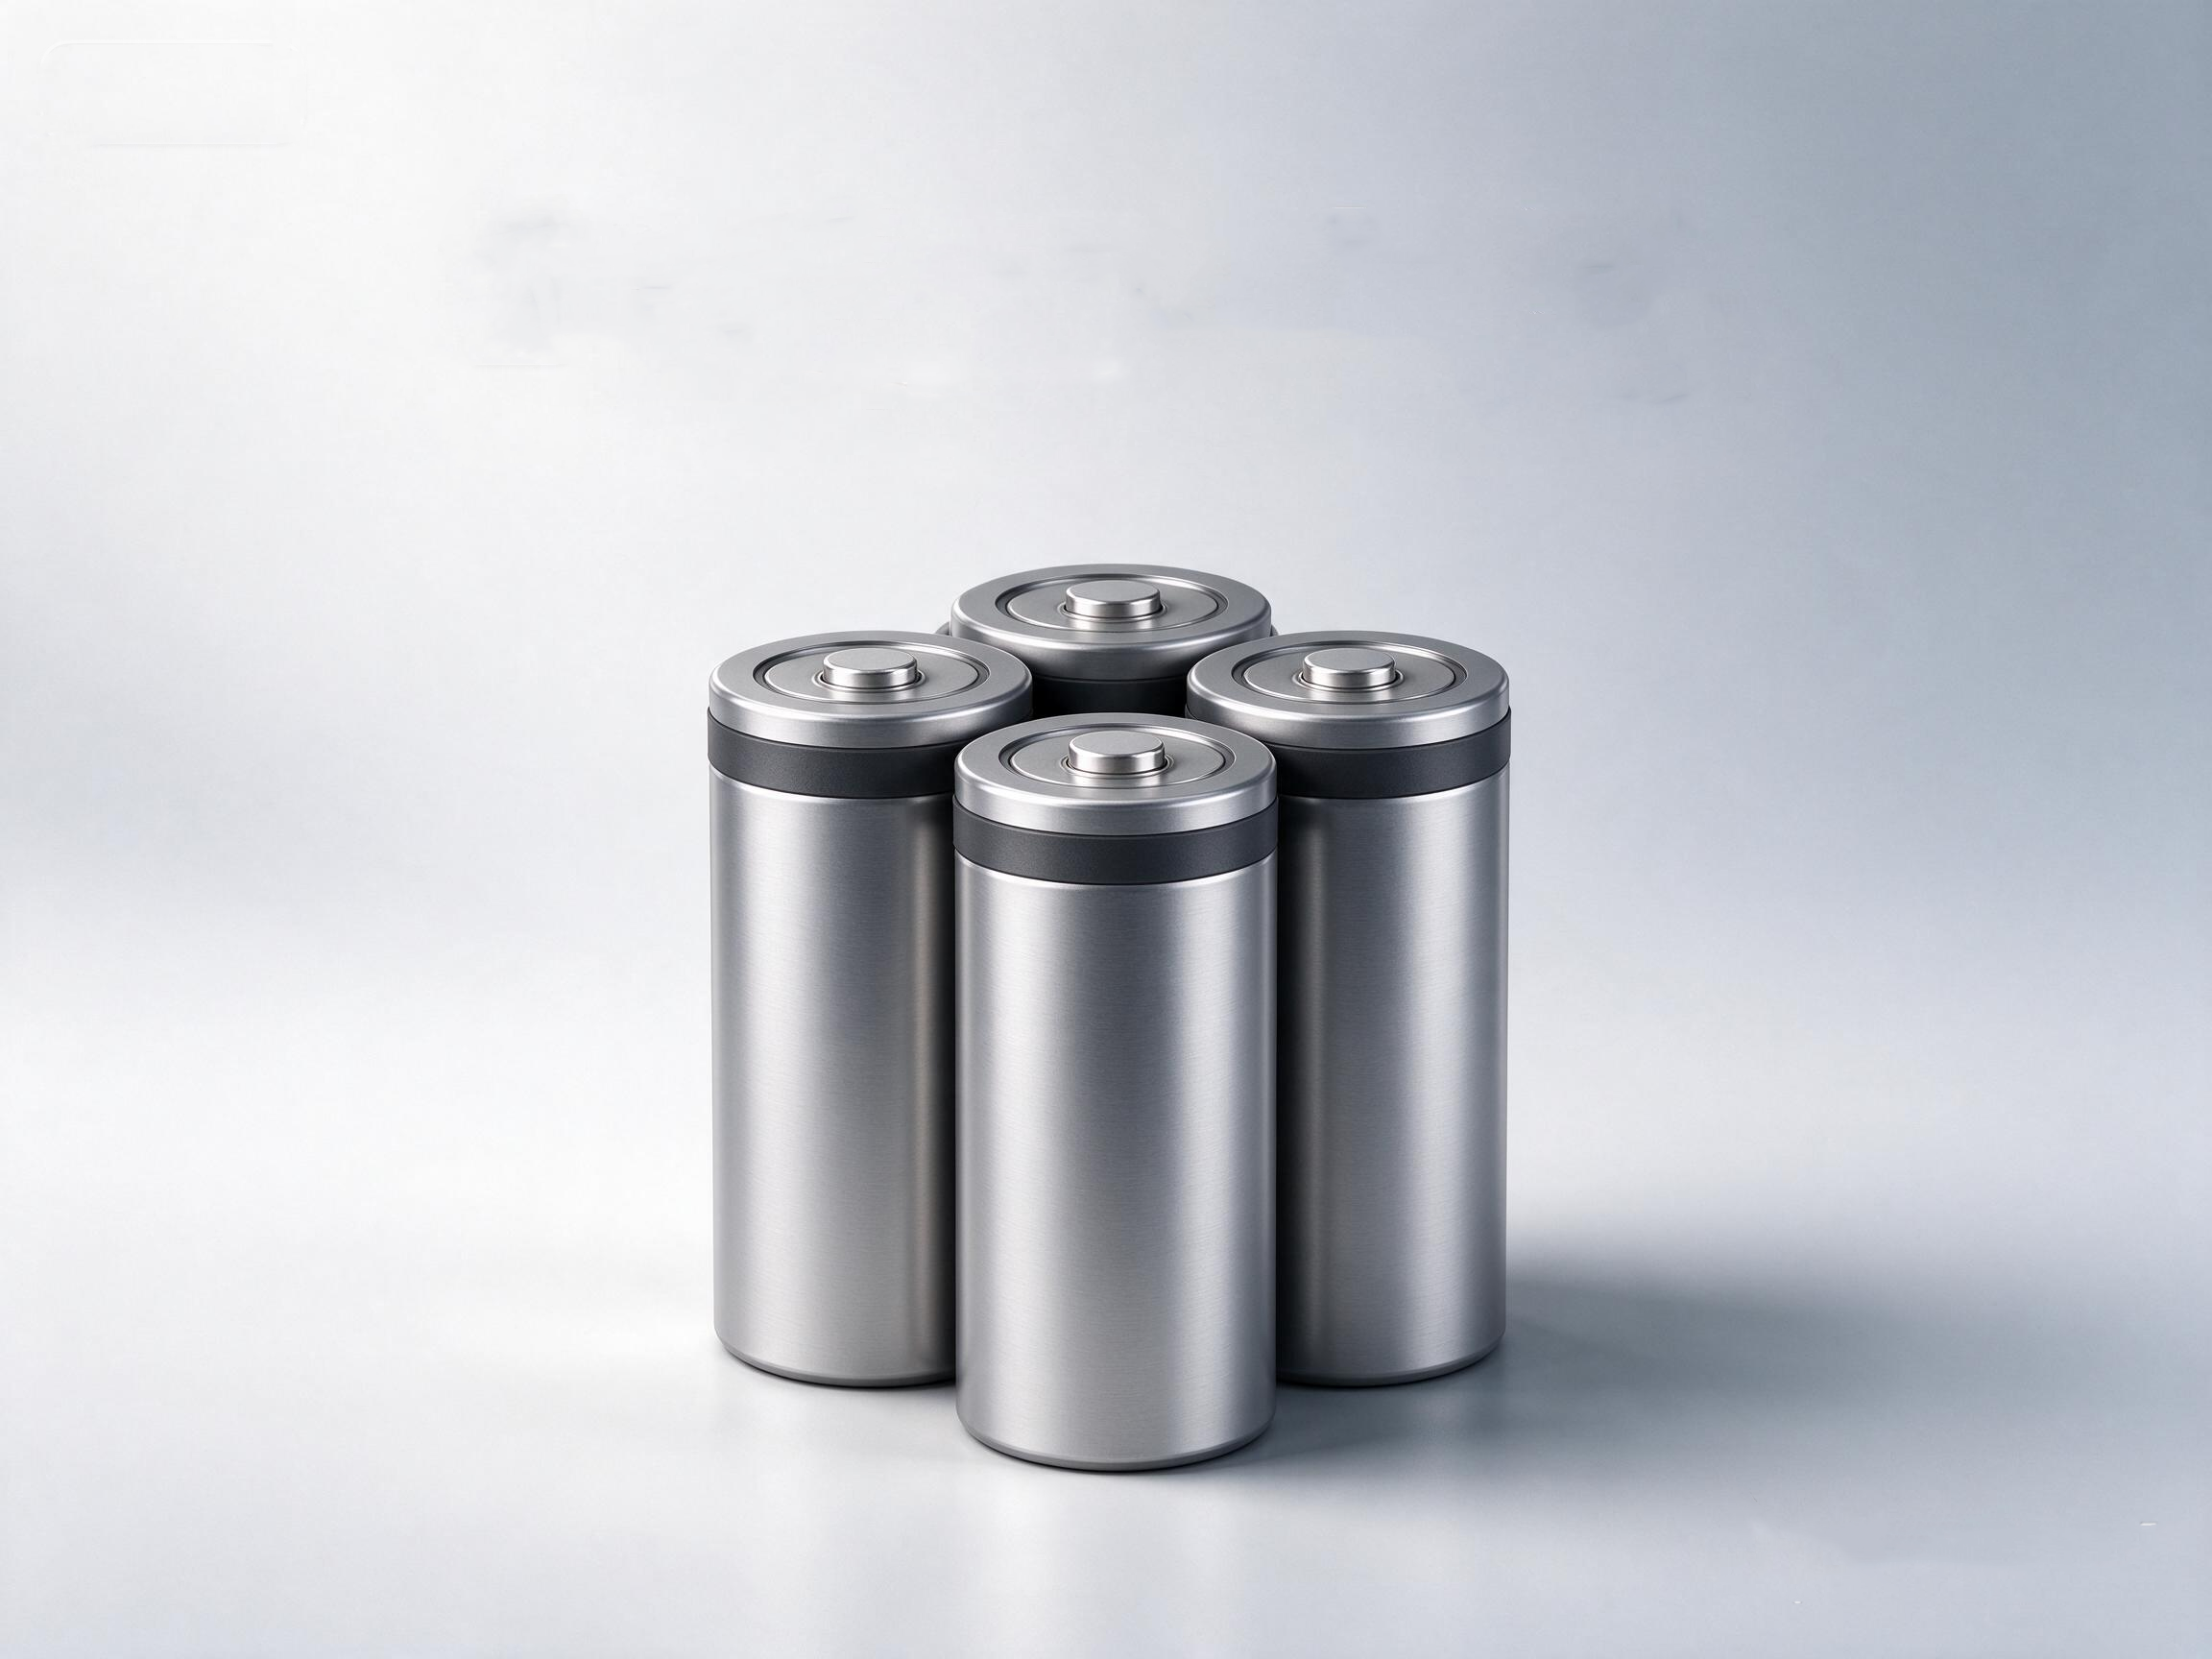
Germany's lithium-ion battery imports under HS 85076000 totalled USD 13,667,293,749 in January–July 2026, across 426 declarations. More than half of that value came from one non-EU origin, while EU-based plants supplied about two fifths. This article sets out the origin mix, the unit-value spread and the limits of what declaration data can tell a German buyer.
The figures are German import declarations for a single six-digit heading. They do not separate cells, modules and battery packs, and do not identify individual German buyers. Values are in USD; quantity is in units and net weight in metric tonnes.
Import scale and monthly movement
Germany's monthly import bill ranged from USD 1.68bn in January to USD 2.35bn in June, averaging USD 1.952bn over the seven months. The first quarter rose month by month, eased in April, then recovered through May and June before a 17.94% fall in July.
| Month | Value (USD) | Share | MoM |
|---|---|---|---|
| Jan | 1,684,195,394 | 12.32% | — |
| Feb | 1,844,969,342 | 13.50% | +9.55% |
| Mar | 2,168,356,913 | 15.87% | +17.53% |
| Apr | 1,827,279,922 | 13.37% | -15.73% |
| May | 1,868,312,234 | 13.67% | +2.25% |
| Jun | 2,347,657,726 | 17.18% | +25.66% |
| Jul | 1,926,522,218 | 14.10% | -17.94% |
| Total | 13,667,293,749 | 100% | — |
Whether the July fall reflects softer downstream demand or inventory pulled into June cannot be settled from declarations alone. Cumulative figures for the period:
| Metric | Value |
|---|---|
| Import value | USD 13,667,293,749 |
| Import quantity | 207,113,798 units |
| Net weight | 553,134 metric tonnes |
| Average unit value | USD 65.99 per unit |
| Average value per tonne | USD 24,708 |
Supply origins and EU dependence
Of the value assigned to the twelve largest origins, 55.49% came from outside the EU and 40.97% from EU-based origins. Smaller origins outside the top twelve account for the remaining 3.54%.
EU-based origins, 40.97%: Hungary, Netherlands, Poland, Czechia, Finland, Austria, Croatia and France.
Non-EU origins, 55.49%: China, South Korea and the United States.
| Origin | Value (USD) | Share | Value per unit (USD) |
|---|---|---|---|
| China | 7,034,669,184 | 51.47% | 58.50 |
| Hungary | 2,316,675,168 | 16.95% | 104.67 |
| Netherlands | 1,135,340,224 | 8.31% | 129.31 |
| Poland | 918,414,704 | 6.72% | 299.67 |
| Czechia | 349,513,088 | 2.56% | 534.21 |
| Finland | 342,814,968 | 2.51% | 631.52 |
| South Korea | 297,004,994 | 2.17% | 27.36 |
| United States | 251,726,355 | 1.84% | 15.61 |
| Czechia (other basis) | 225,228,312 | 1.65% | 281.43 |
| Austria | 176,581,503 | 1.29% | 192.94 |
| Croatia | 68,432,408 | 0.51% | 3106.19 |
| France | 66,231,711 | 0.48% | 51.35 |
China alone covers 51.47% of the import bill, more than three times Hungary, the largest EU-based origin at 16.95%. The top five origins account for 86.01% of value and the top ten for 95.47%. EU-based supply, much of it Hungarian, Polish and Czech cell capacity serving regional vehicle plants, covers just over two fifths. The source data contains two Czechia records under different statistical treatments; they are shown separately and have not been consolidated.
Is the origin mix widening?
China was the largest origin in all seven months, but its share moved from 60.33% in January to 47.34% in July, a fall of 12.99 percentage points. The low point was 44.61% in June, when total German imports rose faster than Chinese supply. For supply planning, the direction matters more than any single month: the origin mix is slowly widening, even though one country still covers half the bill.
| Month | From China (USD) | Total imports (USD) | China share |
|---|---|---|---|
| Jan | 1,016,049,248 | 1,684,195,394 | 60.33% |
| Feb | 976,374,624 | 1,844,969,342 | 52.92% |
| Mar | 1,166,846,880 | 2,168,356,913 | 53.81% |
| Apr | 991,793,280 | 1,827,279,922 | 54.28% |
| May | 924,379,520 | 1,868,312,234 | 49.48% |
| Jun | 1,047,189,696 | 2,347,657,726 | 44.61% |
| Jul | 912,035,936 | 1,926,522,218 | 47.34% |
| Total | 7,034,669,184 | 13,667,293,749 | 51.47% |
What Germany is buying: the unit-value spread
The overall average of USD 65.99 per battery hides two markets in German downstream industry.
Low-value imports: United States 15.61, South Korea 27.36 and China 58.50 USD per unit, pointing to consumer and small-format cells.
High-value imports: Czechia 534.21, Poland 299.67 and Austria 192.94 USD per unit, pointing to large-format or automotive-grade products feeding vehicle and storage programmes.
On a per-tonne basis the same split appears: China 19,742, Hungary 36,364 and Czechia 64,673 USD. Declared unit values reflect product mix and contract terms; they are not current purchase prices.
What the data supports, and what it does not
Supported by the data
An import bill of USD 13.67bn over seven months, averaging USD 1.95bn per month.
China covering 51.47% of value and EU-based origins 40.97%.
China's monthly share falling 12.99 points between January and July.
Unit values separating low-value cells from high-value automotive-grade products.
Not established by the data
Whether the July decline is softer demand or inventory adjustment.
Which German companies bought the goods, or on what contract terms.
The split between cells, modules and packs within the heading.
A current purchase price: declared values are historical, not quotations.
Extending the first-half monthly average gives an indicative full-year 2026 import bill of about USD 23.43bn. This is a straight-line baseline only. Subsidy policy, storage installation schedules and channel inventory can all move the actual result away from it.
Implications for German sourcing
Treat single-origin share as a supply risk. One origin covers 51.47% of the import bill; qualifying second sources and tracking their monthly volumes matters more than the headline total.
Use EU-based capacity as the near-term counterweight. Hungary, Poland and Czechia already supply a meaningful share at unit values suited to automotive-grade demand; their expansion is the most direct route to shortening the supply chain.
Buy by application, not by average price. The USD 15.61–534.21 spread reflects different products. Consumer cells, storage modules and vehicle packs should be benchmarked separately; the 65.99 average is not a usable buying target.
Watch the June-to-July swing before committing volume. A 17.94% month-on-month drop alongside a falling Chinese share may signal a shift in ordering patterns. Confirm with corresponding monthly declarations before adjusting annual contracts.
Verify coverage before using the data for supplier decisions. Request a sample covering HS 85076000, German import direction and January–July, and confirm how importer names and identifiers are recorded. An absent company may be a coverage gap rather than an absence of trade.
Sources and context
SINOBTD Trade Statistics, German import declarations, HS 85076000, January–July 2026. EU and non-EU shares are calculated on the twelve largest origins, which together cover 96.46% of total value. Average unit values are value divided by quantity or net weight. The source data contains two Czechia records under different statistical treatments, shown separately and not consolidated. All figures describe historical declarations and do not represent current offers, contracts or import requirements.
Data in this report is used for analysis only; underlying declaration-level records are not redistributed. For a sample covering this product and period, Contact Us with the country, HS code and research window.